
CICC: How to Hedge AI Risks?

 Prefer us on Google


Author: CICC Asset Allocation: Li Zhao, Yuan Shuai, Yang Xiaoqing, Wang Tianyi
From AI Trading to "AI Dollar": The Dollar Becomes the "Dividing Line" of Global Stock Market Divergence
Against the backdrop of the reconstruction of the international monetary order, we believe that "de-dollarization" remains a prevailing trend, and the dollar faces long-term depreciation pressure. However, since 2026, the dollar has shown a phase of relative strength. In addition to inflationary pressures caused by geopolitical conflicts, the AI market may provide key support. On one hand, cross-border transactions in the AI industry chain, such as advanced chips, cloud services, and computing power, often use the dollar for settlement, and industrial expansion may temporarily increase the demand for dollars, creating the so-called "AI Dollar" effect. On the other hand, AI investments enhance the growth momentum of related economies, especially the United States, where it is expected that nearly 30% of the real GDP growth increment in 2026 will come from AI. The resilience of economic growth creates conditions for the Federal Reserve to raise interest rates, and rising U.S. Treasury yields push up the dollar. However, for economies that benefit less from AI, the strengthening dollar may tighten external financing conditions and increase capital outflow pressure, which could drag down economic and market performance.
Under the influence of the above mechanisms, the dollar has become the dividing line of global stock market divergence in the AI revolution: Since 2026, the stock markets of the United States, Japan, and South Korea, which are deeply involved in the AI industry chain, have shown a positive correlation with the dollar, while the Indian stock market and the Hang Seng Index, which benefit relatively less from AI, have shown a negative correlation with the dollar.
Chart 1: Since 2026, the Nikkei 225 Index has shown a positive correlation with the dollar
Source: Wind, CICC Research Department
Chart 2: Since 2026, the KOSPI Index has shown a positive correlation with the dollar
Source: Wind, CICC Research Department
Chart 3: Since 2026, the Hang Seng Index has shown a negative correlation with the dollar
Source: Wind, CICC Research Department
Chart 4: Since 2026, the Indian stock market has shown a negative correlation with the dollar
Source: Wind, CICC Research Department
Chart 5: Since 2026, the correlation of the dollar index with major asset trends: the dollar becomes the "dividing line" of global stock market divergence
Note: Data for various assets as of October 8.
Source: Wind, CICC Research Department
Increased Volatility in AI Trading: In Addition to Increasing Defensive Asset Allocation, Dollar Depreciation Trades Can Also Serve as a Hedging Option
Although the AI revolution is still in its early stages, the market has begun to worry about the slowdown in growth of leading companies and whether future returns can cover current massive investments. The market expects that the capital expenditure growth rate of the seven major AI companies in the U.S. will drop from about 90% in 2026 to 36% in 2027, and the uncertainty of investment returns has also intensified the volatility of AI assets.
Chart 6: The market expects AI capital expenditures to continue to grow in 2027, but the growth rate is significantly slowing
Source: Bloomberg, CICC Research Department
In this context, increasing allocations to defensive assets such as cash, Chinese bonds, and high-dividend stocks is reasonable. Additionally, based on the previous analysis, a cooling AI market may weaken the relative growth advantage of the U.S. and the demand for dollars, making dollar depreciation trades a potential hedge against the adjustment pressure on AI assets.
Another advantage of dollar depreciation trades is that their profit scenarios are not limited to a weakening AI market: if the U.S.-Iran situation eases and oil prices fall, or if U.S. inflation improves significantly, prompting the Federal Reserve to shift towards interest rate cuts, AI assets may benefit from improved liquidity, and dollar depreciation trades could also benefit, potentially leading to a simultaneous rise in AI stocks. Therefore, compared to simply reducing AI asset holdings, positioning for dollar depreciation trades can retain exposure to AI upside while providing portfolio protection in various scenarios.
The main risk of this hedging logic is a dollar liquidity crisis. If a severe adjustment in the AI market triggers a concentrated sell-off of global assets, investors may rush to liquidate and obtain dollar cash, which could strengthen the dollar and create a reverse correlation with stocks, rendering the hedging ineffective. However, the current adjustment in the AI market mainly reflects a decline in risk appetite and asset reallocation due to concerns about investment returns, and has not yet evolved into a disorderly liquidity shock, making it more likely that the dollar and tech stocks are positively correlated. Recently, during the adjustment period of U.S. tech stocks, the dollar index also fell from its high on October 14, which aligns with this judgment.
The above analysis mainly focuses on the short-term relationship between exchange rates and stock markets; looking at it over a longer time frame, even if the AI revolution is successful, stock price increases may not necessarily be accompanied by dollar appreciation, due to the "reverse Bassa effect" bringing pressure for real exchange rate depreciation.
Gold is an Effective Tool for Positioning Dollar Depreciation Trades, Recommended for Increased Allocation
The most direct way to position for dollar depreciation trades is to short the dollar, but foreign exchange trading faces many restrictions, so increasing gold allocation may be a more convenient strategy expression. Theoretically, gold, as a substitute asset in the dollar system, has a negative correlation with the dollar, but this relationship has not always been stable historically due to multiple factors affecting gold prices, such as interest rates, inflation, and safe-haven demand. However, entering 2026, the negative correlation between gold and the dollar has significantly strengthened, with the correlation coefficient rising to -81.2%. The dollar and gold are two sides of the same coin, making increasing gold allocation an effective tool for dollar depreciation trades.
Chart 7: Before 2026, the correlation between gold and the dollar was unstable
Source: Wind, World Gold Council, CICC Research Department
Chart 8: Since 2026, the negative correlation between gold and the dollar has significantly strengthened, with a correlation coefficient of -81.2%
Source: Wind, World Gold Council, CICC Research Department
In contrast, the impact of oil prices and U.S. Treasury yields on gold is more reflected as phase disturbances: significant fluctuations in oil prices within the year have not consistently dominated gold price trends, and rising U.S. Treasury yields have not consistently suppressed gold performance.
Chart 9: The decline in oil prices from May to June did not benefit gold; the surge in oil prices in August did not suppress gold
Source: Wind, World Gold Council, CICC Research Department
Chart 10: After July, the rapid rise in U.S. Treasury yields did not hinder gold's rise in August
Source: Wind, World Gold Council, CICC Research Department
In addition to gold, U.S. Treasuries are also a potential choice for positioning dollar depreciation trades, but their win rate may be lower than that of gold: if dollar depreciation is due to falling inflation and interest rate cuts by the Federal Reserve, both gold and U.S. Treasuries may benefit; if dollar depreciation is due to rising U.S. debt risks or a weakening dollar's credit, gold may benefit from demand for alternative assets, while U.S. Treasuries may decline due to rising term premiums.
Historical reviews also support the above judgment. We reviewed all 91 periods of dollar depreciation since 2000 that lasted at least 14 days, and gold rose 84 times, with a win rate of 92.3%, and the median return during these periods was 5.46%; during the same period, the proportions of declines in 2-year and 10-year U.S. Treasury yields were 68.1% and 64.8%, respectively.
Chart 11: Since 2000, during periods of dollar index decline, gold's win rate has been higher than that of other major asset classes
Source: Wind, CICC Research Department
In summary, we recommend increasing gold allocation for positioning dollar depreciation trades to hedge against AI asset risks, in addition to increasing allocations to high-dividend stocks, cash, and Chinese bonds. The cost-effectiveness of U.S. Treasuries may also gradually improve, and we suggest keeping a close watch.
-- Price
This content is provided for general informational purposes only and doesn't constitute financial, investment, legal, or tax advice. Any events, rewards, online promotions, or related information mentioned herein should not be considered a recommendation, solicitation, or invitation to purchase, sell, trade, or otherwise deal in any crypto assets. Crypto assets are highly volatile and may result in loss. The availability of WEEX services, products, and related events may vary by region. You are responsible for ensuring that your participation is in accordance with applicable local laws and regulations.
You may also like

Goldman Sachs: Silver Market Faces $2.2 Billion Sell-off and Dual Pressure
JPMorgan: Tech Sector Expected to Have $400 Billion Surplus This Year, AI Investment Cycle Stable
LiteLLM Suffers Supply Chain Attack, Malicious Version 1.107.0 Steals Sensitive Data
Swell DAO Admin Keys Suspected of Being Compromised, Malicious Contracts Threaten to Steal 2,500 ETH
Railway Security Incident: Potential Leak of User Environment Variables and API Keys, All Deployments Suspended

Anthropic Launches Research Preview of Claude Duet

NEAR AI tops 1 million tokens staked as rewards fund AI inference
Anthropic PBC Plans Spending Up to $750 Billion Before IPO

CoreWeave Launches Physical AI Launchables to Simplify Physical AI Workloads
Jensen Huang: Future Telecom Base Stations Expected to Evolve into Distributed AI Networks, All Telecom Operators Will Provide AI Computing Power
FSB Proposes 12 Practices for AI Governance in Financial Institutions

Aethir Updates ATH Token Economic Mechanism, Daily Burn Mechanism Launches in November

Morgan Stanley: What Can the U.S. Midterm Elections Change? AI and Fiscal Policy Take Center Stage
Is 2008 Repeating? CDS Returns to Market Focus
Anthropic Reports $16.3 Billion Revenue in First Half, Future Computing Commitments May Reach $75 Billion

Grayscale Research Director Says Decline in Computing Stocks, Demand Will Remain
Google Cloud Outage: Revolut Paralyzed, Crypto Balances Show Zero

MoneyGram Joins XDC Network as Institutional Validator
Morgan Stanley Warns of Multiple Risks in U.S. AI Infrastructure Investment, Predicts 32 GW Power Shortage by 2028
Xie Jiayin: TiDB Cloud Hacked, Bitget Suspended for Two Months Without Data Leakage

Capital as Production Capacity: Where Did the Money of the Top 100 VC and CVC in the U.S. Go in the First Three Quarters of 2026?
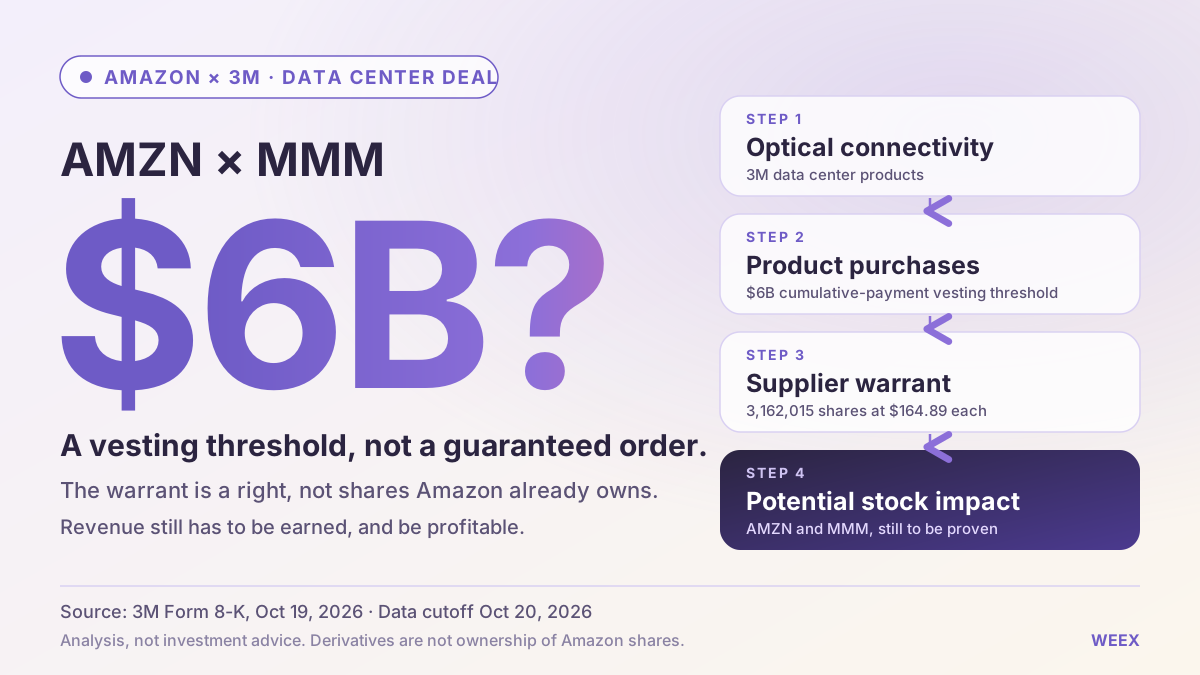
Amazon’s 3M Data Center Deal: What It Means for Amazon (AMZN) and 3M (MMM) Stock
Assess Amazon’s 3M data center deal, the $6 billion warrant threshold, potential dilution, and what the agreement could mean for AMZN and MMM stock.

Why Are Companies Reducing AI Spending? What It Means for AI Stocks

Elice Group IPO Plummets 28% on First Day

Bitdeer AI Cloud Business Backlog Reaches $2.9 Billion, Bitcoin Production Grows 200% in September

Phala Cloud Attacked, Some Customer Logs and Environment Variables Read

CITIC Securities: Market Overestimation of CoreWeave Concerns, New Cloud Providers' Short-Term Funding Gap 'Still Manageable'

Global Economic Resilience Faces Test as High Rates and Supply Risks Impact Asset Allocation
10-Year Yield Plummets 17 Basis Points in a Week! AI Trading Turmoil Rekindles Safe-Haven Attributes of U.S. Treasuries
Ministry of Commerce Promotes Application of New Technologies such as Blockchain to Enhance Trade Development
Goldman Sachs: Silver Market Faces $2.2 Billion Sell-off and Dual Pressure
JPMorgan: Tech Sector Expected to Have $400 Billion Surplus This Year, AI Investment Cycle Stable
LiteLLM Suffers Supply Chain Attack, Malicious Version 1.107.0 Steals Sensitive Data
Swell DAO Admin Keys Suspected of Being Compromised, Malicious Contracts Threaten to Steal 2,500 ETH
Railway Security Incident: Potential Leak of User Environment Variables and API Keys, All Deployments Suspended
Anthropic Launches Research Preview of Claude Duet