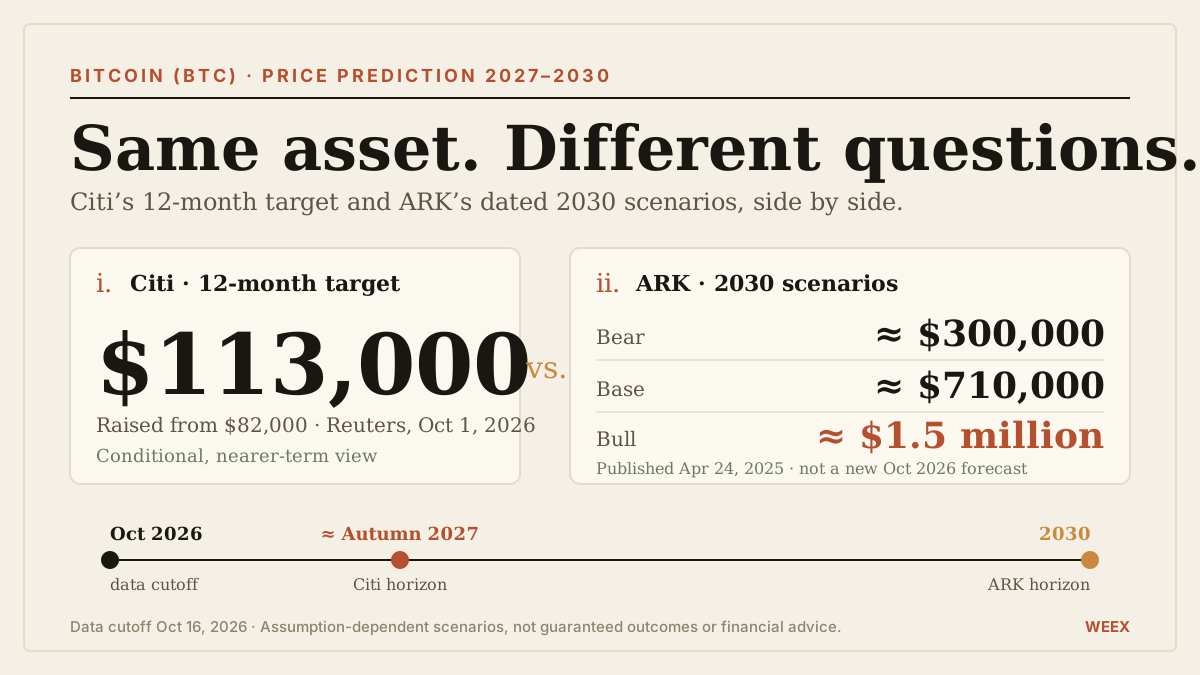
Bitcoin (BTC) could reach higher prices by 2027 or 2030, but Citi’s reported $113,000 target and ARK’s widely cited long-term scenarios answer different questions. Citi’s October 2026 forecast covers the following 12 months. ARK’s verified April 2025 scenario analysis targets 2030. Neither provides a guaranteed price path, and the older ARK figures should not be presented as newly issued October 2026 forecasts.
Our view is that the most useful BTC forecast compares assumptions before comparing headline prices. A shorter-term call based on improving market flows cannot be treated as equivalent to a multi-year model of global adoption. Investors should ask what must happen, by when, and what evidence would invalidate the prediction.
The WEEX Bitcoin (BTC)/USDT Futures page is the relevant destination for contract exposure, followed by the Bitcoin (BTC)/USDT Spot page for direct buying and selling. The futures page returned incomplete quotes and a restriction message during this review, so verify current order availability rather than assuming the contract is immediately executable.
By WEEX SEO Team | Data cutoff: October 16, 2026
What Is Citi’s Bitcoin (BTC) Price Prediction for 2027?
Reuters reported on October 1, 2026, that Citi raised its 12-month Bitcoin target to $113,000 from $82,000, citing stronger activity, a supportive macroeconomic backdrop, and returning ETF inflows. The report also described expectations for approximately $5 billion in inflows over the following 12 months.
The forecast’s horizon is essential.
A 12-month target reported in early October 2026 points approximately to autumn 2027. It is not automatically a December 31, 2027 closing-price forecast.
It is also a target, not a minimum price. Bitcoin could trade above or below that level during the period and finish elsewhere.
The reported revision illustrates how forecasts respond to changing assumptions. A target can increase when an analyst expects more supportive demand conditions, and it can decrease if those conditions deteriorate.
Investors searching for “Citi Bitcoin price prediction 2027” should therefore preserve three details: the publication date, the 12-month horizon, and the conditions underlying the estimate.
Removing those details turns a conditional research view into an apparently timeless promise.
What Is Cathie Wood’s Bitcoin (BTC) Price Prediction for 2030?
The phrase “Cathie Wood Bitcoin price prediction 2030” often refers to ARK Invest research rather than a standalone personal guarantee from Cathie Wood.
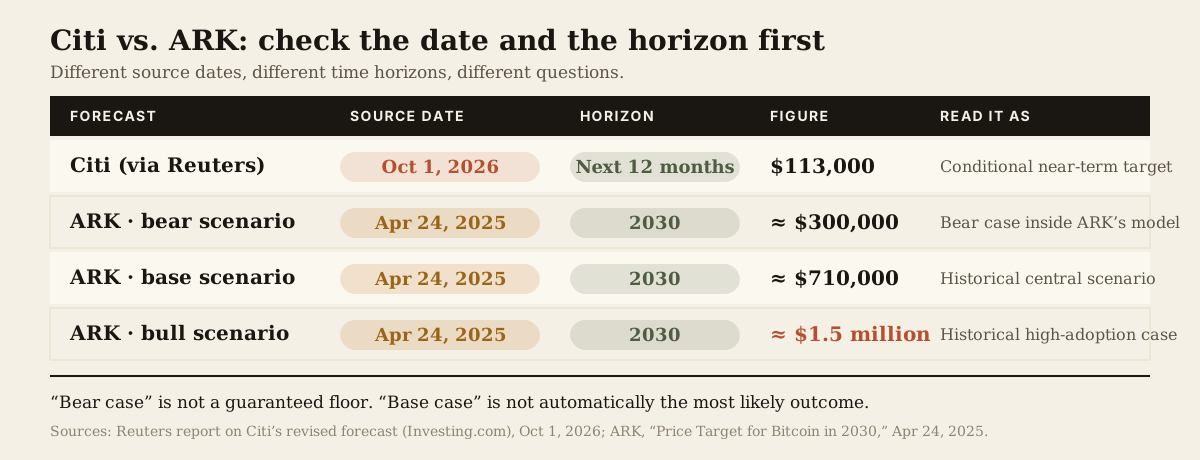
ARK’s official article dated April 24, 2025, sets out 2030 scenarios of approximately $300,000 in the bear case, $710,000 in the base case, and $1.5 million in the bull case. The article explicitly identifies these as assumption-dependent projections. They are historical published scenarios, not newly issued targets as of this article’s October 2026 cutoff.
That date distinction is particularly important for content accuracy.
An article can be current while discussing an older forecast. It becomes misleading when it presents that forecast as the institution’s latest verified position without checking for subsequent research.
ARK published further institutional Bitcoin analysis in February 2026, emphasizing its view of Bitcoin’s evolving role in portfolios. That supports discussion of the broader thesis, but it does not justify relabeling the April 2025 scenario table as a new October 2026 forecast.
For readers, the appropriate question is not simply whether ARK is bullish. It is which document produced the number being quoted.
A forecast’s source date is part of the forecast.
Comparing the Bitcoin (BTC) Forecasts Without Mixing Their Horizons
Citi and ARK can be compared, but the comparison must preserve their different analytical purposes.
Citi’s reported target is useful for examining whether a nearer-term recovery could develop under supportive conditions. ARK’s dated scenarios are useful for understanding how large-scale adoption assumptions can produce much higher long-term valuations.
The term “bear case” deserves particular attention. It does not mean ARK established a guaranteed downside floor for Bitcoin.
A bear scenario within one institution’s framework may still assume substantial adoption. Actual outcomes can fall below that framework.
Likewise, “base case” is not synonymous with the most likely market outcome unless a model establishes that interpretation. A scenario table does not automatically provide statistically calibrated probabilities.
This is one reason a comparison based only on the largest target can mislead readers.
How Much Upside Do the Bitcoin (BTC) Targets Imply?
To compare the scale of the forecasts, this article uses a rounded $82,000 reference price for sensitivity calculations. That is a modeling anchor, not a guaranteed current quote or executable price.
The WEEX spot page retrieved during the review displayed a price close to $82,300 in its page title. Crypto prices change continuously, so a rounded anchor is more appropriate than implying precision across sources collected at different moments.
Calculations exclude fees, taxes, funding payments, and changes in the reference price.
The table shows why the forecasts require different explanations.
A move to $113,000 would be a meaningful recovery. A move to $710,000 would represent a much larger transformation in Bitcoin’s valuation.
The longer time horizon allows more room for adoption, but it also introduces more uncertainty. Regulation, market access, competing assets, custody practices, and investor preferences can change over several years.
A higher target should therefore come with a more explicit explanation of its assumptions, not simply a longer deadline.
What Could Drive Bitcoin (BTC) Toward $113,000?
For a nearer-term recovery, the most important question is whether demand persists after the initial improvement in sentiment.
Spot bitcoin ETF inflows can be relevant because they provide a route for capital to enter through established investment products. But one positive day does not establish a durable trend.
A stronger signal would be repeated net demand across several weeks, distributed across products rather than concentrated in an isolated event.
Price behavior also matters. A market that absorbs selling and holds gains provides different evidence from a market that rallies briefly and returns to its prior range.
Crypto liquidity is another variable. If investors have more capacity and willingness to hold volatile assets, Bitcoin may benefit. However, a broad liquidity narrative does not establish a mechanical relationship with price.
Interest rates and the dollar should be interpreted through their effect on financial conditions and investor behavior. A rate cut associated with severe economic stress may produce a different response from one associated with stable growth.
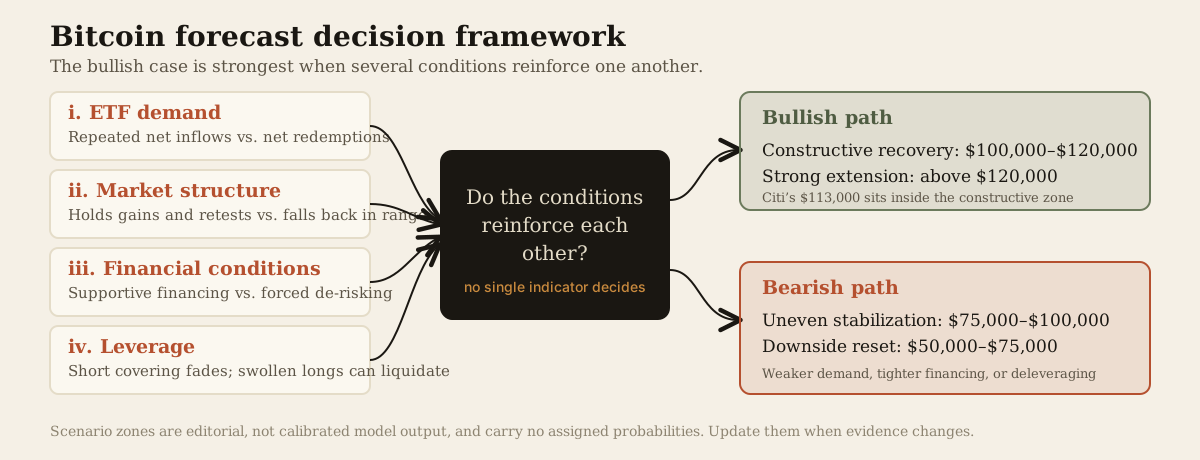
The bullish case is strongest when several conditions reinforce one another: sustained demand, manageable selling pressure, improving market structure, and financing conditions that do not force investors to reduce exposure.
No single indicator can substitute for that combination.
What Would Be Required for Bitcoin (BTC) to Reach Much Higher Prices by 2030?
Long-term targets require a larger adoption argument.
Bitcoin would need investors to assign it a substantially greater role in portfolios, reserves, or other holdings. That is an economic choice made by institutions and individuals, not an automatic consequence of limited supply.
A useful way to understand the scale is through an illustrative market-cap calculation.
Assume, solely for this sensitivity exercise, that 20.5 million BTC are in circulation at the relevant future date.
The assumed future supply is a modeling input, not a live measurement.
These valuations do not represent the exact cash inflows required. Market capitalization reflects marginal price multiplied by supply.
Nevertheless, the scale remains economically meaningful. A valuation in the tens of trillions would imply that Bitcoin had become a much more important global asset.
The long-term bullish case therefore depends on sustained allocation decisions, not only on traders paying higher prices to one another during a speculative cycle.
Why Adoption Can Grow Without a Smooth Price Path
An asset can gain users and institutional access while suffering major drawdowns.
Prices reflect the balance between expectations and realized conditions. If investors price in rapid adoption and actual progress is slower, the asset can decline even while adoption continues.
Existing holders can also supply substantial inventory. New demand does not interact only with newly created coins.
This is why a scarcity thesis should account for willingness to sell, market depth, and the opportunity cost of holding the asset.
The investment question is not whether supply is constrained in the abstract. It is whether demand at the current price exceeds the supply offered for sale.
Bitcoin (BTC) Price Prediction for 2027: A Conditional Framework
Rather than treating $113,000 as an inevitable destination, investors can organize the 2027 outlook around observable conditions.
The following are editorial scenario zones, not estimates generated by a calibrated statistical model.
The constructive zone includes Citi’s reported target, but that does not validate the entire range or assign it a probability.
The table is intended to make the thesis testable.
For example, a market showing persistent outflows and repeated failure to hold recoveries would not support the same interpretation as a market absorbing selling pressure and establishing higher weekly lows.
The key is to update the scenario when evidence changes.
A forecast should be a framework for interpreting new information, not a commitment to defend a number.
What Could Invalidate a Bullish Bitcoin (BTC) Forecast?
The most direct invalidation would be a sustained failure of the expected demand to materialize.
If investment products repeatedly experience net redemptions, institutional allocation develops more slowly than expected, or financial conditions become less supportive, the bullish assumptions weaken.
Leverage can also distort the apparent strength of a recovery.
A rally driven largely by short covering may fade after those positions close. A rally accompanied by rapidly expanding leveraged longs can become vulnerable to liquidation if price reverses.
Open interest does not reveal direction by itself. It measures outstanding contracts, with a long and a short on each contract.
The quality of demand matters more than the excitement of the price move.
For long-term investors, another invalidation risk is valuation discipline. Adoption may improve while the asset still underperforms because too much future success was already reflected in the purchase price.
A good asset can be a poor investment at an excessive valuation.
How to Use a Bitcoin (BTC) Price Chart Alongside Institutional Forecasts
Institutional targets should be treated as context. The chart helps assess how the market is behaving now.
Begin with a weekly view to identify the broader range and trend. Then use the daily chart to evaluate whether recent advances are holding or repeatedly failing.
A breakout becomes more convincing when the market remains above the prior range and successfully absorbs a retest. A temporary move above resistance followed by a rapid return inside the range provides weaker evidence.
Avoid mixing a long-term thesis with an intraday signal without explaining the connection. A five-minute momentum move cannot confirm a 2030 adoption scenario.
Similarly, a current funding rate cannot establish the price several years ahead. Funding is relevant to the cost and positioning of a perpetual contract, not a direct measure of long-term fair value.
No live moving-average, RSI, or liquidation-map figure is supplied here because a consistent timestamped dataset was not established for those calculations.
Trading Bitcoin (BTC) Futures on WEEX: Match the Instrument to the Forecast
A 2030 target is not a reason to assume that a leveraged position can be held safely until 2030.
Inspect the WEEX BTC/USDT Futures page and confirm current trading availability, contract specifications, funding terms, and margin requirements.
For direct exposure, the WEEX BTC/USDT Spot page provides the corresponding market destination.
The difference is practical. An unleveraged spot position can lose market value, but it does not face liquidation from leverage. A futures position can be closed by the platform’s risk process before a long-term forecast has time to develop.
Funding also matters over extended holding periods. A position that appears attractive based only on entry and target prices may have a different result after recurring funding payments and execution costs.
Before choosing a position size, define the amount of capital at risk, the point at which the trade thesis is invalidated, and how an adverse move would affect the account.
No current Bitcoin-specific trading campaign or fee reduction was verified for this cutoff, so promotional savings are not included in the analysis.
FAQ
1. What Is Citi’s Bitcoin Price Prediction for 2027?
Reuters reported on October 1, 2026, that Citi’s 12-month target was $113,000. The horizon points approximately to autumn 2027, rather than automatically referring to the end of the calendar year.
2. What Is Cathie Wood’s Bitcoin Price Prediction for 2030?
A widely cited ARK article published in April 2025 presented approximately $300,000, $710,000, and $1.5 million scenarios for 2030. These should be attributed to that dated research rather than described as newly issued October 2026 targets.
3. Is ARK’s Bear Case a Guaranteed Minimum Price?
No. A bear scenario is an outcome within a particular model and its assumptions. Bitcoin could perform worse than that scenario if the underlying adoption assumptions are not met.
4. Could Bitcoin Reach $1 Million?
It is a possible high-adoption scenario, not an established outcome. At an illustrative future supply of 20.5 million BTC, $1 million would imply approximately $20.5 trillion in market capitalization.
5. Should a Long-Term Forecast Determine Futures Leverage?
No. Leverage should reflect risk capacity, contract mechanics, and the trade’s invalidation point. A long-term bullish view does not prevent short-term liquidation.
WEEX View: Bitcoin (BTC) Forecasts Are Only as Useful as Their Assumptions
Citi’s reported $113,000 target offers a nearer-term proposition that can be evaluated against demand and market conditions over the following year.
ARK’s dated 2030 scenarios describe a more ambitious adoption framework. They are useful for understanding the scale of a long-term bullish thesis, but they should retain their original publication date and model limitations.
Our conclusion is that investors should spend less time choosing their favorite target and more time identifying the evidence that would make it credible. Sustained demand, market resilience, and a valuation consistent with actual adoption are more informative than a headline number alone.
Sources: Reuters report on Citi’s revised forecast, republished by Investing.com, October 1, 2026; ARK’s Price Target for Bitcoin in 2030, April 24, 2025; Bitcoin’s Evolving Institutional Role, February 11, 2026; official WEEX Bitcoin futures and spot pages.


 Prefer us on Google